To calculate result you have to disable your ad blocker first.
T Value (Critical Value) Calculator
Select the type of probability, enter the degree of freedom and significance level to calculate t value using our t value calculator.
Table of Contents:
- Critical Value Calculator
- What is the t value?
- T critical value formula
- How to find the critical value of t?
- How to Calculate the T-Critical Value for a One-Tailed Distribution Table?
- T Distribution Table (One Tail)
- How to Calculate the T-Critical Value for a Two-Tailed Distribution Table?
- T Distribution Table (Two Tail)
- Frequently Asked Questions About T Critical Values
Critical Value Calculator
T critical value calculator is an online statistical tool that calculates the t value for one-tailed and two-tailed probability. Moreover, the critical values calculator also shows the mapped t-value in the student t-distribution table for one sample and two samples.
What is the t value?
T value measures the size of the difference relative to the variation in sample data. It is basically the calculated difference represented in units of standard error.
- If the t value is greater, there is evidence of a significant difference.
- If the t-value is closer to 0, there are chances of no significant difference.
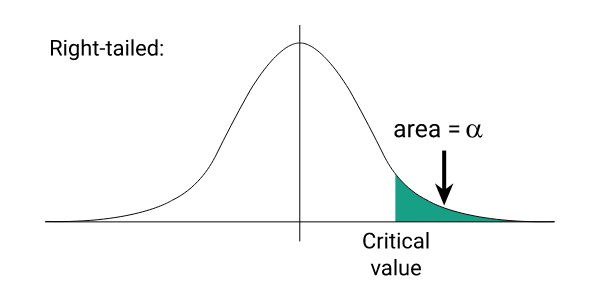
Right-Tailed T Critical Value

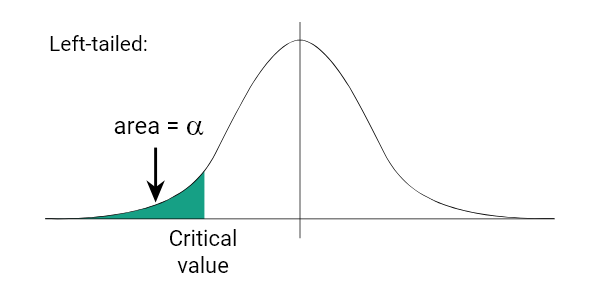
Left-Tailed T Critical Value

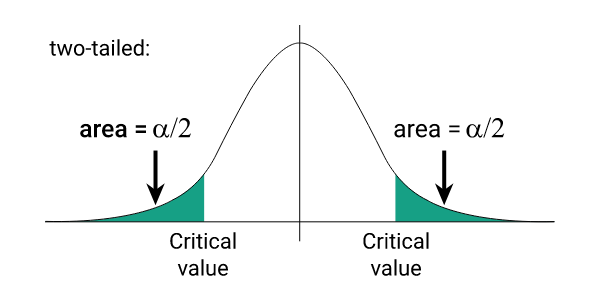
Two-Tailed T Critical Value

T critical value formula
The formulas of t critical value for left, right, and two-tailed values are:
| Name of Type | Formula of t critical value |
| Right-tailed | Qt,d(1 - α) |
| Left-tailed | Qt,d (α) |
| Two-tailed | ±Qt,d (1 - α/2) |
How to find the critical value of t?
To calculate the t critical value manually (without using the t calculator), follow the example below.
Example:
Calculate the critical t value (one tail and two tails) for a significance level of 5% and 30 degrees of freedom.
Solution:
Step 1: Identify the values.
Significance level = 5% = 5/100 = 0.05
Degree of freedom = 30
Step 2: Look for the significance level in the top row of the t distribution table below (one tail) and degree of freedom (df) on the left side of the table. Get the corresponding value from a table.
T critical value (one-tailed) = 1.6978
Step 3: Repeat the above step but use the two-tailed t table below for two-tailed probability.
T critical value (two-tailed +/-) = 2.0428
Use our t table calculator above to quickly get t table values.
How to Calculate the T-Critical Value for a One-Tailed Distribution Table?
To calculate the T-critical value by one-tail t-distribution table, we have a proper significance level and degrees of freedom of the experimental data. Follow the below step to find its value.
First, take the one-tailed table, and the level of significance for one tail is written at the top of the table.
Choose the column from the table that contains the respective level of significance.
Then find the row for the degrees of freedom that match with your experimental data.
Finally, note the intersection value of the column and the rows from the table. That is the required T-critical value of your data or place is positive for the right-tailed test & negative for left left-tailed test.
To overcome this long process use our above T Critical Value calculator that provides answers in minor seconds.
T Distribution Table (One Tail)
The t table for one-tailed probability is given below.
| DF | A = 0.1 | 0.05 | 0.025 | 0.01 | 0.005 | 0.001 | 0.0005 |
|---|---|---|---|---|---|---|---|
| ∞ | ta= 1.282 | 1.645 | 1.960 | 2.326 | 2.576 | 3.091 | 3.291 |
| 1 | 3.078 | 6.314 | 12.706 | 31.821 | 63.656 | 318.289 | 636.578 |
| 2 | 1.886 | 2.920 | 4.303 | 6.965 | 9.925 | 22.328 | 31.600 |
| 3 | 1.638 | 2.353 | 3.182 | 4.541 | 5.841 | 10.214 | 12.924 |
| 4 | 1.533 | 2.132 | 2.776 | 3.747 | 4.604 | 7.173 | 8.610 |
| 5 | 1.476 | 2.015 | 2.571 | 3.365 | 4.032 | 5.894 | 6.869 |
| 6 | 1.440 | 1.943 | 2.447 | 3.143 | 3.707 | 5.208 | 5.959 |
| 7 | 1.415 | 1.895 | 2.365 | 2.998 | 3.499 | 4.785 | 5.408 |
| 8 | 1.397 | 1.860 | 2.306 | 2.896 | 3.355 | 4.501 | 5.041 |
| 9 | 1.383 | 1.833 | 2.262 | 2.821 | 3.250 | 4.297 | 4.781 |
| 10 | 1.372 | 1.812 | 2.228 | 2.764 | 3.169 | 4.144 | 4.587 |
| 11 | 1.363 | 1.796 | 2.201 | 2.718 | 3.106 | 4.025 | 4.437 |
| 12 | 1.356 | 1.782 | 2.179 | 2.681 | 3.055 | 3.930 | 4.318 |
| 13 | 1.350 | 1.771 | 2.160 | 2.650 | 3.012 | 3.852 | 4.221 |
| 14 | 1.345 | 1.761 | 2.145 | 2.624 | 2.977 | 3.787 | 4.140 |
| 15 | 1.341 | 1.753 | 2.131 | 2.602 | 2.947 | 3.733 | 4.073 |
| 16 | 1.337 | 1.746 | 2.120 | 2.583 | 2.921 | 3.686 | 4.015 |
| 17 | 1.333 | 1.740 | 2.110 | 2.567 | 2.898 | 3.646 | 3.965 |
| 18 | 1.330 | 1.734 | 2.101 | 2.552 | 2.878 | 3.610 | 3.922 |
| 19 | 1.328 | 1.729 | 2.093 | 2.539 | 2.861 | 3.579 | 3.883 |
| 20 | 1.325 | 1.725 | 2.086 | 2.528 | 2.845 | 3.552 | 3.850 |
| 21 | 1.323 | 1.721 | 2.080 | 2.518 | 2.831 | 3.527 | 3.819 |
| 22 | 1.321 | 1.717 | 2.074 | 2.508 | 2.819 | 3.505 | 3.792 |
| 23 | 1.319 | 1.714 | 2.069 | 2.500 | 2.807 | 3.485 | 3.768 |
| 24 | 1.318 | 1.711 | 2.064 | 2.492 | 2.797 | 3.467 | 3.745 |
| 25 | 1.316 | 1.708 | 2.060 | 2.485 | 2.787 | 3.450 | 3.725 |
| 26 | 1.315 | 1.706 | 2.056 | 2.479 | 2.779 | 3.435 | 3.707 |
| 27 | 1.314 | 1.703 | 2.052 | 2.473 | 2.771 | 3.421 | 3.689 |
| 28 | 1.313 | 1.701 | 2.048 | 2.467 | 2.763 | 3.408 | 3.674 |
| 29 | 1.311 | 1.699 | 2.045 | 2.462 | 2.756 | 3.396 | 3.660 |
| 30 | 1.310 | 1.697 | 2.042 | 2.457 | 2.750 | 3.385 | 3.646 |
| 60 | 1.296 | 1.671 | 2.000 | 2.390 | 2.660 | 3.232 | 3.460 |
| 120 | 1.289 | 1.658 | 1.980 | 2.358 | 2.617 | 3.160 | 3.373 |
| 1000 | 1.282 | 1.646 | 1.962 | 2.330 | 2.581 | 3.098 | 3.300 |
How to Calculate the T-Critical Value for a Two-Tailed Distribution Table?
Calculating the T-critical value for the two-tailed t-test by the t-distribution table, we required the value significance level and degrees of freedom of the given data to determine the value from a table. Follow the below step to find its value.
First, take the two-tailed table, and the level of significance is properly mentioned at the top of the table.
Choose the column from the t-distribution table that contains the significance level of your data.
Then find the row with respect to the degrees of freedom of your data in the selecting column of your level of significance.
Then the intersection value of the level of significance in the column and the degrees of freedom in the row is the required T-critical value of your data.
To verify the answer to your data, use the above T-Critical Value calculator.
T Distribution Table (Two Tail)
Here is the t table for two-tailed probability.
| DF | A = 0.2 | 0.10 | 0.05 | 0.02 | 0.01 | 0.002 | 0.001 |
|---|---|---|---|---|---|---|---|
| ∞ | ta = 1.282 | 1.645 | 1.960 | 2.326 | 2.576 | 3.091 | 3.291 |
| 1 | 3.078 | 6.314 | 12.706 | 31.821 | 63.656 | 318.289 | 636.578 |
| 2 | 1.886 | 2.920 | 4.303 | 6.965 | 9.925 | 22.328 | 31.600 |
| 3 | 1.638 | 2.353 | 3.182 | 4.541 | 5.841 | 10.214 | 12.924 |
| 4 | 1.533 | 2.132 | 2.776 | 3.747 | 4.604 | 7.173 | 8.610 |
| 5 | 1.476 | 2.015 | 2.571 | 3.365 | 4.032 | 5.894 | 6.869 |
| 6 | 1.440 | 1.943 | 2.447 | 3.143 | 3.707 | 5.208 | 5.959 |
| 7 | 1.415 | 1.895 | 2.365 | 2.998 | 3.499 | 4.785 | 5.408 |
| 8 | 1.397 | 1.860 | 2.306 | 2.896 | 3.355 | 4.501 | 5.041 |
| 9 | 1.383 | 1.833 | 2.262 | 2.821 | 3.250 | 4.297 | 4.781 |
| 10 | 1.372 | 1.812 | 2.228 | 2.764 | 3.169 | 4.144 | 4.587 |
| 11 | 1.363 | 1.796 | 2.201 | 2.718 | 3.106 | 4.025 | 4.437 |
| 12 | 1.356 | 1.782 | 2.179 | 2.681 | 3.055 | 3.930 | 4.318 |
| 13 | 1.350 | 1.771 | 2.160 | 2.650 | 3.012 | 3.852 | 4.221 |
| 14 | 1.345 | 1.761 | 2.145 | 2.624 | 2.977 | 3.787 | 4.140 |
| 15 | 1.341 | 1.753 | 2.131 | 2.602 | 2.947 | 3.733 | 4.073 |
| 16 | 1.337 | 1.746 | 2.120 | 2.583 | 2.921 | 3.686 | 4.015 |
| 17 | 1.333 | 1.740 | 2.110 | 2.567 | 2.898 | 3.646 | 3.965 |
| 18 | 1.330 | 1.734 | 2.101 | 2.552 | 2.878 | 3.610 | 3.922 |
| 19 | 1.328 | 1.729 | 2.093 | 2.539 | 2.861 | 3.579 | 3.883 |
| 20 | 1.325 | 1.725 | 2.086 | 2.528 | 2.845 | 3.552 | 3.850 |
| 21 | 1.323 | 1.721 | 2.080 | 2.518 | 2.831 | 3.527 | 3.819 |
| 22 | 1.321 | 1.717 | 2.074 | 2.508 | 2.819 | 3.505 | 3.792 |
| 23 | 1.319 | 1.714 | 2.069 | 2.500 | 2.807 | 3.485 | 3.768 |
| 24 | 1.318 | 1.711 | 2.064 | 2.492 | 2.797 | 3.467 | 3.745 |
| 25 | 1.316 | 1.708 | 2.060 | 2.485 | 2.787 | 3.450 | 3.725 |
| 26 | 1.315 | 1.706 | 2.056 | 2.479 | 2.779 | 3.435 | 3.707 |
| 27 | 1.314 | 1.703 | 2.052 | 2.473 | 2.771 | 3.421 | 3.689 |
| 28 | 1.313 | 1.701 | 2.048 | 2.467 | 2.763 | 3.408 | 3.674 |
| 29 | 1.311 | 1.699 | 2.045 | 2.462 | 2.756 | 3.396 | 3.660 |
| 30 | 1.310 | 1.697 | 2.042 | 2.457 | 2.750 | 3.385 | 3.646 |
| 60 | 1.296 | 1.671 | 2.000 | 2.390 | 2.660 | 3.232 | 3.460 |
| 120 | 1.289 | 1.658 | 1.980 | 2.358 | 2.617 | 3.160 | 3.373 |
| ∞ | 1.282 | 1.645 | 1.960 | 2.326 | 2.576 | 3.091 | 3.291 |
Frequently Asked Questions About T Critical Values
What is the Critical Value?
Critical value is found in the statistics for the analysis of the data of any experiment that helps us for the testing of the hypothesis and tells us whether the null hypothesis should be rejected or not.
What are the Different Types of Critical Value?
There are four different types of critical values depending on the distribution or test used for the analysis of data and also the sample size/ population size of data. These names and distribution are given below:
- T-critical value (Student t-distribution used in T-test)
- Z-critical value (Normal distribution used to find this value)
- Chi-square value (Chi-squared distribution used to find this value)
- F-critical value (F-distribution used for this value)
What is the difference between T-test & Z-test?
T-test & Z-test, both are parametric statistical tests that are used to measure the interval scale and find the different critical values according to the size of the sample by using t-distribution and normal distribution. T-test is applied if the sample size is smaller than n<30 while Z-test is applied if the sample size is larger than n>30.
Can a T-Critical Value be Negative?
Yes, the t-critical value is negative if the left-tailed test is conducted to find its value and the value is placed along the left side of the mean in the graphical distribution. i.e., if the critical value is -1.5 then is placed to the left side of the mean while if it’s positive “1.5” then placed to the right of the mean.

