To calculate result you have to disable your ad blocker first.
Correlation Coefficient Calculator
To find correlation coefficient, fill the required input boxes and click calculate button using correlation coefficient calculator
Correlation coefficient Calculator
Use the correlation coefficient calculator to find the strength of the relationship between variables using Pearson's and Spearman’s methods.
The main feature of this calculator is its explained result. It contains everything from the basics like the value of the correlation coefficient to the correlation test, graph, and residual normality.
Everything is presented through charts, graphs, and images. It will provide covariance and p-value as well.
What are correlation and its coefficient?
The correlation is similar to covariance. It can be thought of as the older family member of covariance.
Where covariance provides the direction of a relationship between bivariant data the correlation goes to the next level and gives its numerical representation.
Correlation coefficient:
The correlation coefficient is also the same, finding the strength of the relation between the variables and how they affect each other. It is denoted by “r”.
Furthermore, the value of “r” is always between the range of positive and negative one.
- When the value of r is > 0 or equal to one, it means the variables are directly related.
- Conversely, when the value is -1 or less than 0, it depicts the indirect relation.
- Lastly, as expected, a zero correlation coefficient points to the absence of any relation.
Note: The significance of the correlation coefficient depends largely on the size of the sample data. The more values, the more significant answer.
Correlation coefficient methods:
The famous and common in use methods are Pearson’s and Spearman’s rank methods. Both are calculated differently. Below is the guide for manual calculations.
Pearson’s correlation coefficient:
Named after its inventor, this method uses the given formula:
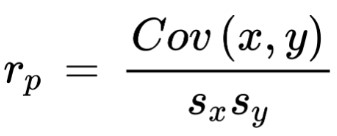
Here:
- Cov(x,y) is the covariance of both variables.
- sx and sy are standard deviations.
This method is applicable to linear data sets only.
Spearman’s rank CC:
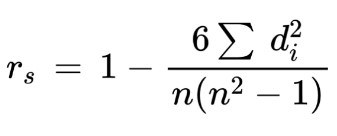
Sigma d2 means the summation of the square of the difference between ranks.
Spearman’s method can find the correlation of curved data as well.
How to calculate the correlation coefficient?
The first method is easy. You have to:
- Find the covariance of both variables.
- Calculate the standard deviation of x and y and multiply them.
- Divide the covariance with this value.
Example: (Pearson’s)
For the following sets of data, what is the correlation coefficient?
A = (2,8,9,10,1,1)
B = (10,11,7,1,0,1)
Solution:
Step 1: Find covariance.
N = 6
Mean of X = 5.17
Mean of Y = 5
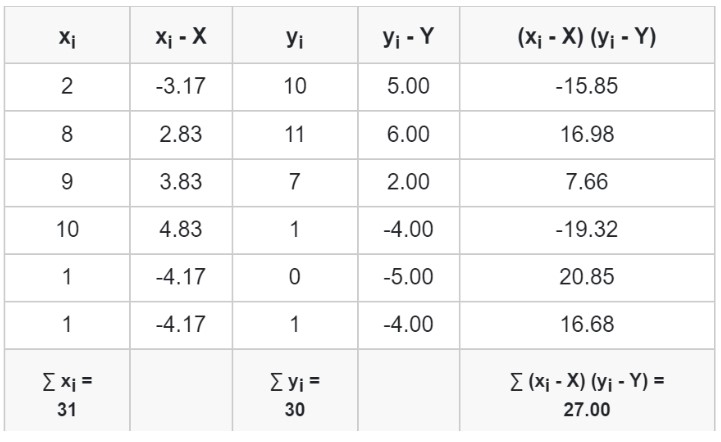
Putting in the covariance formula.
Cov (x,y) = ∑ (xi - X) (yi - Y) / N - 1
Cov (x,y) = 27 / 5
Covx,y = 5.40
Step 2: Standard deviations of x and y.
Of X:
s2 = ∑(xi - x̄)2/(N - 1)
s2 = (2 - 5.17)2 + (8 - 5.17)2 + (9 - 5.17)2 + (10 - 5.17)2 + (1 - 5.17)2 + (1 - 5.17)2 / 5
s2 = (10.0489 + 8.0089 + 14.6689 + 23.3289 + 17.3889 + 17.3889) / 5
s2 = 18.17
S = 4.26
Of Y:
s2 = ∑(xi - x̄)2/(N - 1)
s2 = (10 - 5)2 + (11 - 5)2 + (7 - 5)2 + (1 - 5)2 + (0 - 5)2 + (1 - 5)2 / 5
s2 = (25 + 36 + 4 + 16 + 25 + 16) / 5
s2 = 24.4
S = 4.94
Step 3: Use the Pearson’s formula.
= Cov (x,y) / Sx Sy
= 5.40 / (4.26)(4.96)
= 5.40 / 21.12
= 0.256
Example: (Spearman’s)
For the following set of data, find the spearman’s correlation coefficient.
A = (2,8,9,10,1,3)
B = (10,11,7,1,0,3)
Solution:
Step 1: Make ranks of the data sets. Rank in the ascending order e.g give the highest number 1st rank and so on.
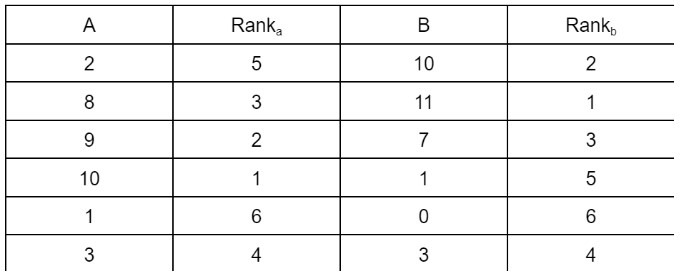
Step 2: Add two more columns. Subtract rank A from rank B and square the difference.
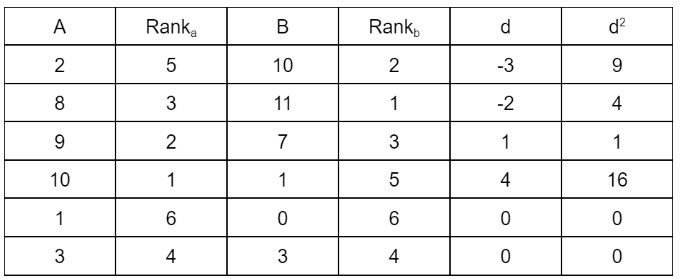
Step 3: Add this square.
= 9 + 4 + 1 + 16 + 0 + 0
= 30
Step 4: Enter in the formula.

rs = 1 - {6 (30)} /{6(36-1)}
rs = 1 - 0.85
rs = 0.142

