To calculate result you have to disable your ad blocker first.
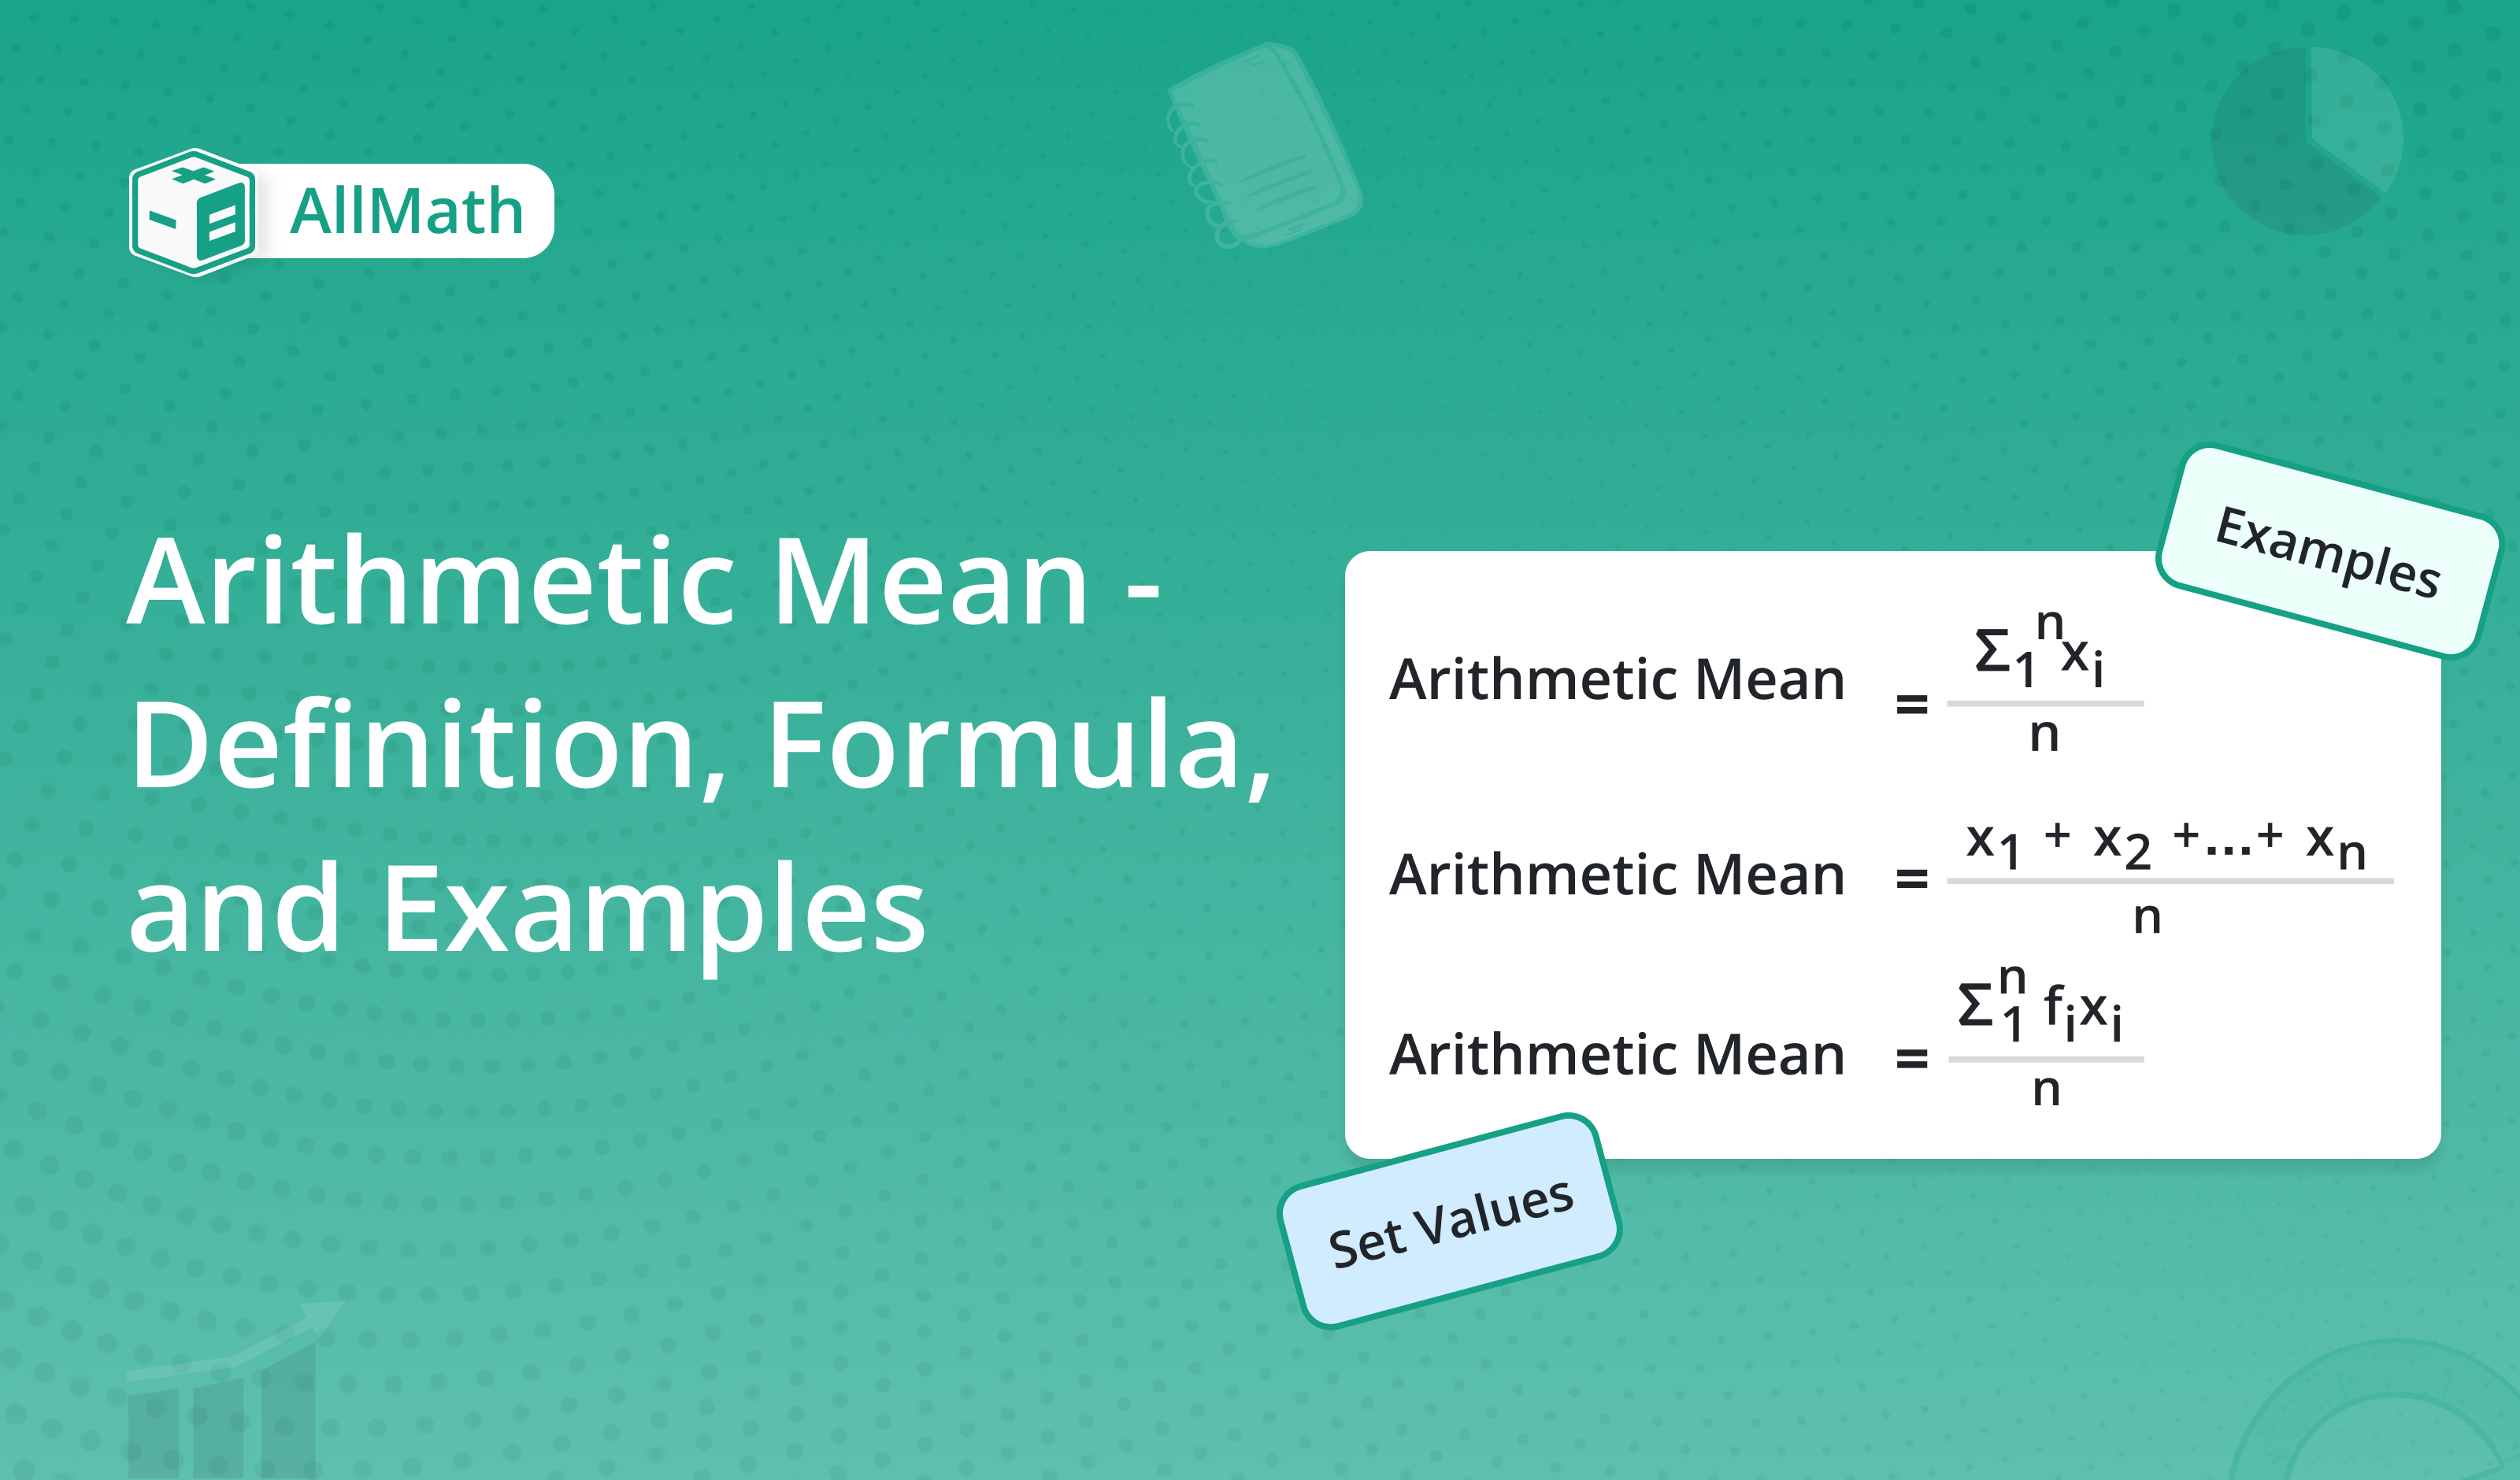
Arithmetic Mean - Definition, Formula, and Examples

Publish Date: 08 Aug, 2023
Table of Content
Central Tenancies are measures of location that summarise a dataset by giving a “single quantitative value” within the range of the data values.
This tendency describes its (value’s) location relative to the entire data. Some common measures are:
- Arithmetic mean
- Geometric mean
- Harmonic mean
- Median
- Mode
The most common, from all the measures that are mentioned above, is the Arithmetic mean.
You would probably have heard your teacher saying “ this time the average score of the class is 70” or your friend saying “I get 10 bucks a month on average”. At that time, they are referring to the arithmetic mean.
So, What is the arithmetic mean (A.P) and How to calculate it? To know the answer to these questions and to learn more about A.P, keep reading.
Arithmetic Mean Definition
Arithmetic mean and Average are different names for the same thing. It is obtained by the sum of all the numbers divided by the number of observations.
It is used very often in daily life. But in day-to-day life, people often skip the word arithmetic or simply use the layman's term “average”.
Arithmetic Mean Formula
Arithmetic mean is very easy to compute. But regardless of this fact, it does have a formula.
A.P = Sum of all the observations / No. of observations
For ungrouped data

Here, n is equal to n1 + n2 + ... + nn.
The drawback of A.P and Weighted Arithmetic Mean
Arithmetic mean is not always practical to use. This is because it is highly skewed by the outliers, values relatively very high or lower than the rest of the data.
Also, the arithmetic mean fails to give a satisfactory average of the grouped data. This is the reason, weighted arithmetic mean is used.
In a data set, if some observations have more importance as compared to the other observations then taking a simple average Is misleading.
In this case, different weights are assigned to different observations according to their relative importance And then the average is calculated by considering weights as well.
This value is called weighted Arithmetic mean or simple weighted mean (W.P), and it is donated by XÌ„w. Its formula is derived from the arithmetic mean and that is why, both A.P and W.M are learned together.
For grouped data

In the grouped data equation:
f = Frequency of each class,
x = Midpoint of each class,
N = f1 + f2 + ... +fn (sum of frequencies).
How to find Arithmetic Mean?
For ungrouped data, the arithmetic mean is relatively easy to find. Let’s learn to find the arithmetic mean for grouped and ungrouped data.
Example - Ungrouped data
Find the arithmetic mean for a class of eight students, who scored the following marks for a maths test out of 20.
Student | 1 | 2 | 3 | 4 | 5 | 6 | 7 | 8 |
Marks | 18 | 20 | 19 | 15 | 15 | 14 | 16 | 19 |
Solution
Step 1: Add all the values.
= 18 + 20 + 19 + 15 + 15 + 14 + 16 + 19
= 136
Step 2: Divide by 8 (no of observations).
= 136 / 8
= 17
17 is the average mark of the class.
Example - Grouped data
An examination was held to decide about the award of a scholarship in an institution. The weights of various subjects were different.
The marks obtained by 3 candidates (A, B, and C) out of 100 are given below. If the candidate getting the average score is to be awarded the scholarship, who should get it.
Subject | Weights (%) | XA | XB | XC |
Maths | 40 | 70 | 80 | 91 |
Statistics | 30 | 70 | 75 | 80 |
Economics | 20 | 54 | 57 | 40 |
English | 10 | 70 | 40 | 45 |
Total | 100 | 264 | 252 | 256 |
Solution
The average score of student A.
Step 1: Write all the scores of student A.
Score = 70, 70, 54, 70
Step 2: Multiply score with weight:
= 70 x 40, 70 x 30, 54 x 20, 70 x 10
= 2800, 2100, 1080, 700
= 6680
Step 3: Divide the obtained value by total weight.
= 6680 / 100
= 66.80
Step 4: Find weighted mean for student B and C in the same way.
For student B = 80 x 40 + 75 x 30 + 57 x 20 + 40 x 10 / 100
= 2400 + 1500 + 570 + 4000 / 100
= 8470 / 100
= 84.70
For student C = 91 x 40 + 80 x 30 + 40 x 20 + 45 x 10 / 100
= 3640 + 2400 + 800 + 450 / 100
= 7290 / 100
= 72.90
To show this in a table.
Subject | Weights (%) | XA | XB | XC | WXA | WXB | WXC |
Maths | 40 | 70 | 80 | 91 | 2800 | 2400 | 3640 |
Statistics | 30 | 70 | 75 | 80 | 2100 | 1500 | 2400 |
Economics | 20 | 54 | 57 | 40 | 1080 | 570 | 800 |
English | 10 | 70 | 40 | 45 | 700 | 4000 | 450 |
Total | 100 | 264 | 252 | 256 | 6680 | 8470 | 7290 |
We can see that student B deserves the scholarship.
You can use arithmetic mean calculator to find the mean of grouped and ungrouped data.
Properties of Arithmetic Mean
- The mean of constant is equal to that constant.
- The Sum of deviations of the observations from the mean is equal to zero i.e,

- The sum of the squared deviations from the observations is minimum.

Where a is constant.
- If X1 + X2 + ... +Xn have mean XÌ„ then the main after multiplying each observation by a constant ‘a’ Is the mean multiplied by the constant.

- If a constant ‘a’ is added to each of the observations X1 + X2 + ... +Xn having mean XÌ„ then the mean increases by a constant.

Applications of Arithmetic Mean in daily life
The basic use of the arithmetic mean to find the overall values in different fields. E.g:
- In Finance (to find sales per month in a year)
- In business (to calculate average hired and fired employees)
- In schools ( for grading purposes)
- In governments (to track prosperity and development)
FAQs
What is the difference between the arithmetic mean, median, and mode about outliers?
The difference is on the basis of the importance of outliers. For a data set that is positively skewed, the large value drives A.P up the graph.
Similarly, for negatively skewed data, A.P is driven down the graph
Is arithmetic mean a good parameter for accuracy?
The arithmetic mean is a good parameter when the values of the data set are minorly different. But if there are very high or low values present, the arithmetic mean will not be a good option.
In such cases, the weighted mean is used.
Can arithmetic mean find the middle value or point?
The arithmetic mean is the overall average of the data. It does not tell the exact middle point. To find the middle value, the median is calculated.
What are the types of arithmetic mean?
There are two types of arithmetic mean:
- Simple arithmetic mean
- Weighted harmonic mean
🖩Related Tools
📝Recent Blogs

